
Financial Planning Blog
 Volatility Drag—Geometric vs Arithmetic Returns
Most investors understand that in order to make a higher return on your investments you need to be willing to take higher risks. If all investments were risk free, their expected returns would all be similar to money market funds, T-bills or short term certificates of deposit--barely beating inflation, if you are lucky. The opportunity to take measured risks and earn a higher rate of return is a good thing for investors planning for long term goals such as retirement or paying for college.
Although risk provides opportunity, it also works against the investor. Volatility of returns (the typical financial measure of risk) is emotionally difficult for many. Markets going up and down like a roller coaster not only cause sleepless nights, but often incite us to buy or sell investments at the worst of times. Beyond the emotions, however, risk works against us in another way. As returns become more volatile, there is something that can be referred to as "volatility drag" eating away at the long term return of your investments. We'll look at the difference between "arithmetic" (or simple) averages and "geometric" (or compounded) averages to see how this happens.
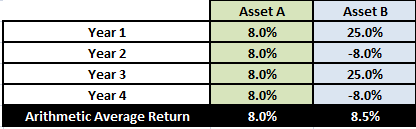
Below are two investments (Assets A and B) and their returns for each of four years. If you do an arithmetic, or simple, average of each of their returns, Asset B is the clear winner with an average return of 8.5% versus Asset A's 8.0%. (The arithmetic average is calculated by simply summing the returns and dividing by 4 years.)
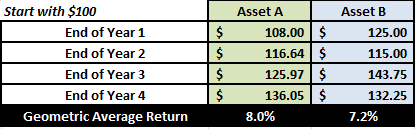
Although it would seem that the owner of Asset B earned a somewhat higher (0.5%) annual return as compensation for the volatility of the investment, is this actually the case? Of course not! As shown below, the owner of Asset A actually ends up with more money. Even though Asset B had a higher arithmetic average return, it geometric (or compounded) average return is significantly less (only 7.2% per year, versus Asset A's 8.0%).
What this simple example demonstrates is that if there is any volatility of returns, then compounded returns will be less than simple average returns. In fact, as volatility increases, the difference between arithmetic and geometric returns also increases.
Why is the difference between geometric and arithmetic averages important to understand and keep in mind? Here are three key reasons:
- When it comes to reaching your financial goals, compound (geometric) returns are what matter, not arithmetic returns. When projecting returns over a long period, the seemingly small difference can be a big deal. For example, you may have heard how the returns from large U.S. company stocks averaged about 12.3% from 1926-2005. However, the geometric average return was just 10.4% per year due to the volatility of the stocks. If you were to use the 12.3% arithmetic average to project the performance of your $100K portfolio until your anticipated retirement, you would plan on over $1.8M after 25 years. If you were to more correctly use the 10.4% compounded return for your projection, you would plan on less than $1.2M after the 25 years. This is no small deviation--over 33% less. (There are other problems with blindly using historical returns for future projections, but we'll leave those for another day.)
- Investors can often be confused or mislead by the incorrect use of average (arithmetic) versus compound (geometric) returns. Often it is hard to tell whether the specified returns are simple averages or compounded over time. This may be intentional obfuscation, or simple ignorance by those selling an investment product--neither would be surprising.
- Reducing the risk of your investment portfolio has the potential added benefit of reducing this volatility drag. The difference between the arithmetic return and geometric return increases as volatility increases. The goal is to find an asset allocation that minimizes the expected volatility (or risk, usually measured by standard deviation) for a desired expected return. Not only is lower risk easier on your psyche, it can actually help increase long term compounded returns. Although you generally need to take on more risk to get higher returns, there is a penalty for taking more risk than you need to.
After a couple of years where your portfolio may have dropped 50% and then risen 50%, leaving you still down 25% (instead of even), the difference between compounded and simple averages may be fairly intuitive. In other situations the differences are often more subtle, and easy to miss. Make sure you understand these simple concepts and it will help increase the potential for hitting your financial goals.
Next page: Disclosures