


Measuring inflation is a dauntingly complex task, as we saw in Part 2. But with Social Security benefits, pension payments, tax brackets, investment and insurance products, not to mention a host of labor and other contracts all linked to an “official” inflation rate, it is a measurement that impacts everyone’s pocketbook. One can’t help seeing a parallel with a similar statistical mystery–the Bowl Championship Series. Football fans in Idaho are well acquainted with that politically deceitful, statistically convoluted black box that can be counted on each year to send Boise State to the Little Sisters of the Poor Bowl while schools with proper pedigrees divide the financial spoils of the BCS. (See this video on What If Everything Worked Like the BCS–The Spelling Bee.)
We know the BCS is complicated. We know the BCS is crooked. We’ve almost learned to live with that. But, could it possibly be that measuring inflation is even more complicated than the BCS…and just as crooked?
“There are three kinds of lies: lies, damned lies, and statistics.” – Mark Twain (attributed to Benjamin Disraeli)
Unless you are into anti-government conspiracy theories–after all this is Idaho, and we do love to hate the Feds–you may never have given much thought to the possibility that the official inflation numbers published by the Bureau of Labor Statistics (BLS) have been manipulated to your detriment. Over the last few decades the BLS has made important changes to how it calculates the CPI that significantly lower the reported inflation numbers. This is no secret, and the methodology and impact of these changes is well documented. There is considerable controversy, however, as to whether these changes were appropriate, or part of a complex plot to lower the official CPI estimates to order to minimize inflation’s apparent impact. And, more importantly, minimize the on-going increases of government expenditures linked to the CPI.
First, a quick summary of the controversial changes in CPI measurement:
- In 1983 the way the changes to cost of owner-occupied housing is measured was significantly modified. A new measurement called owner’s equivalent of rent (OER) was substituted for the change in actual housing prices. OER measures the amount a homeowner would have to pay to rent their home, or alternatively would earn by renting their house out in a competitive market. The reasoning behind using OER instead of house prices is that owner-occupied housing consists of both a consumption element and an investment element, and the CPI is designed to exclude investments (e.g. stocks, bonds, real estate.) This is certainly reasonable when you consider that contrary to other price increases, homeowners are usually very happy when the values of their homes rise. There is no arguing that using OER instead of house price changes has resulted in a much more stable index. For example, since 2000 housing prices changes as measured by the Case-Shiller Index have swung wildly between +20% and -20% per year, while OER has moved in a narrow range between 2% and 5%.
- In 1999 the BLS began using a geometric mean formula in the calculation of the CPI. This methodology seeks to reflect consumer substitution behavior, where people make trade-offs on the basis of both price and personal preferences in an effort to maximize their standard of living. Critics claim that if the price of filet mignon goes up, and consumers switch to hamburger, the BLS simply substitutes hamburger for steak and calls it even. The BLS adamantly denies this type of substitution is made, and makes a very reasonable defense. (For an understandable, but lengthy explanation of these changes and other see this 2008 BLS article–Addressing Misconceptions about the Consumer Price Index.)
- Starting in 1998 and phased in over time are hedonic (derived from the Greek word for pleasure) statistical models that adjust for quality changes. Using multiple regression analysis the value of new features or quality changes is estimated by comparing the prices of items with and without that feature. Basically, the BLS is trying to estimate what portion of a price increase (or decrease) is due to quality changes, and whether the consumer is left better or worse off. (Again, see the BLS article for a good explanation.)
On one side of the inflation controversy are economists that contend that the CPI for years was systematically overstating price levels to the tune of 0.8% to 1.6% per year. These were the findings of the Boskin Commission, appointed by the Senate Finance Committee in 1995 to study the effectiveness of the CPI estimates, finally resulting in the late 90′s changes mentioned above.
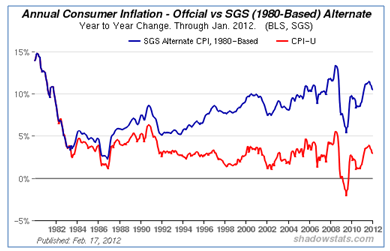
In the other camp are those that believe the pre-1982 methods of measuring inflation would give a truer picture of the debasing of the dollar and the impact of price changes on people’s well-being. A well known, vocal proponent of this point of view is Walter J. “John” Williams and his work can be found on his Shadow Government Statistics website. Here is his 2006 take on the changes to CPI measurement:
The CPI was designed to help businesses, individuals and the government adjust their financial planning and considerations for the impact of inflation. The CPI worked reasonably well for those purposes into the early-1980s. In recent decades, however, the reporting system increasingly succumbed to pressures from miscreant politicians, who were and are intent upon stealing income from social security recipients, without ever taking the issue of reduced entitlement payments before the public or Congress for approval.
In particular, changes made in CPI methodology during the Clinton Administration understated inflation significantly, and, through a cumulative effect with earlier changes that began in the late-Carter and early Reagan Administrations have reduced current social security payments by roughly half from where they would have been otherwise. That means Social Security checks today would be about double had the various changes not been made. In like manner, anyone involved in commerce, who relies on receiving payments adjusted for the CPI, has been similarly damaged. On the other side, if you are making payments based on the CPI (i.e., the federal government), you are making out like a bandit.
According to Shadow Stats, the current annualized inflation rate, measured using older pre-1982 methodology is about 10.5%, compared to the official rate of a little over 2.9%–over 7% higher!
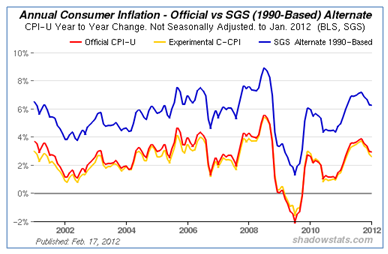
Ignoring the 1983 housing change, the cumulative impact of the other methodological changes is less dramatic, but still significantly large enough to be make a major dent in the COLA adjustments to your government check.
Are Williams and other critics right, and the federal government is manipulating statistics to hold the official inflation down? I’m not qualified to pass final judgment on the BLS statisics, but I have to say their methodology seems OK to me. For one thing, if the Shadow Stats’ numbers were used and Social Security and government pensions were all about double today’s level–does that even pass the smell test? It’s not like wages and salaries have been rising at a screaming pace. Does it seem right that Social Security benefits and pensions should be rising at over 10% per year? I don’t think so.
Just because inflation used to be calculated one way, doesn’t mean that is the way it should be done in perpetuity. Just because cost-of-living increases were calculated in the 70′s using the old way, doesn’t mean it’s a good idea for the new millennium. And, just because college football has always had a corrupt bowl system where elite colleges meet to crown a champion and divide the TV money, doesn’t mean that is the way it always has to be.
Like the CPI, we should give economists a chance to redesign the college football post season and bring it into the 21st century. One thing for sure, it would certainly look different than the current BCS. Unfortunately for BSU, however, the championship will likely still require kicking a field goal.